Research
PaperBanana: The AI Tool That Automates Scientific Diagram Creation
In the academic world, writing scientific papers represents a considerable challenge. But beyond the text, an often underestimated obstacle slows down researchers: creating methodological diagrams and illustrations.
These visuals, essential for effectively communicating complex concepts, require precious time and design skills that not all scientists possess. This is precisely the problem that PaperBanana, developed by Google Cloud AI Research in collaboration with Peking University, seeks to solve.
Addressing a Major Bottleneck
Despite spectacular advances in language models and autonomous AI scientists capable of analyzing literature or generating hypotheses, creating academic illustrations remains largely manual. Researchers must juggle professional tools like Adobe Illustrator or settle for basic solutions. PaperBanana changes the game by offering an agentic framework capable of automatically generating methodology diagrams and statistical plots ready for publication.
[1/n]
— Dawei Zhu (@dwzhu128) February 2, 2026
Super excited to introduce PaperBanana 🍌! (PKU x Google Cloud AI)
As AI researchers, we often spend way too much time crafting diagrams and plots instead of focusing on the ideas 🤯. To rescue us from this burden, we built an Agentic Framework to auto-generate… pic.twitter.com/tWTiNrT5QH
PaperBanana’s approach relies on intelligent orchestration of five specialized agents, each with a specific role. This modular architecture breaks down the complex task of illustration generation into logical and manageable steps.
How Does PaperBanana Work?
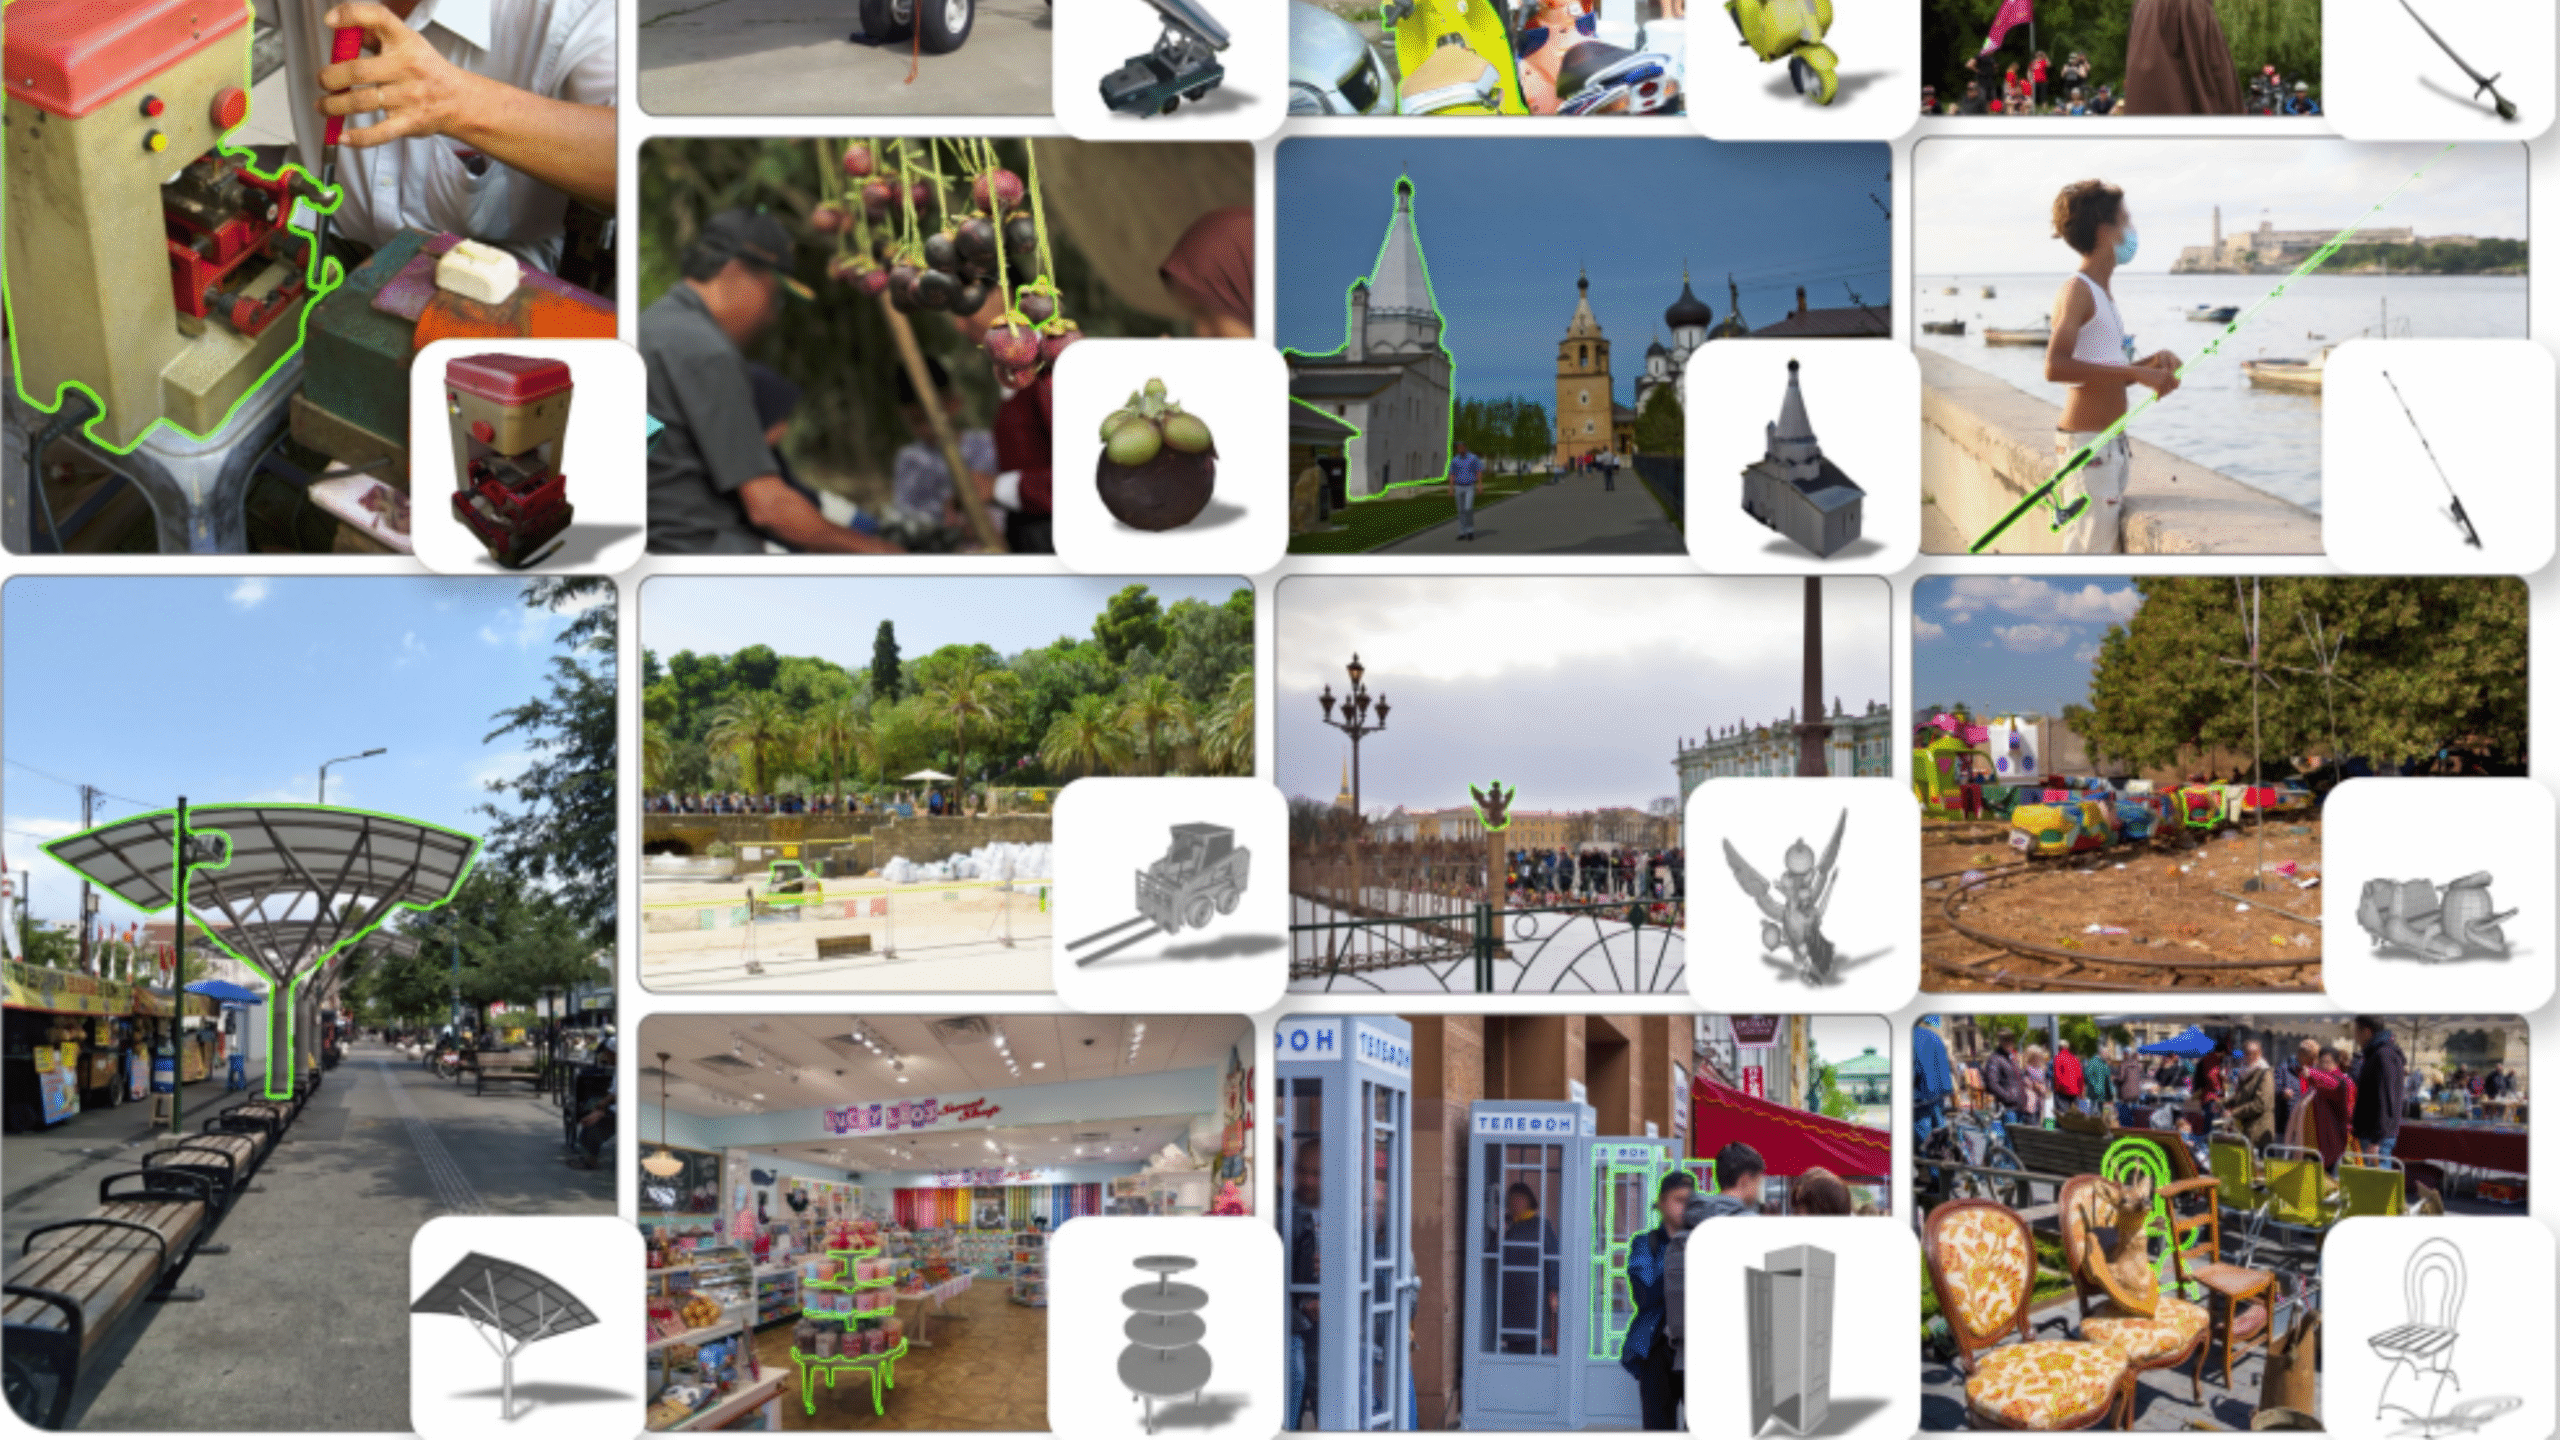
The system operates through a two-phase process. The first, called the linear planning phase, begins with the retriever agent that identifies relevant reference examples from a database of existing diagrams. These examples come from NeurIPS 2025 publications and serve as stylistic and structural guides.
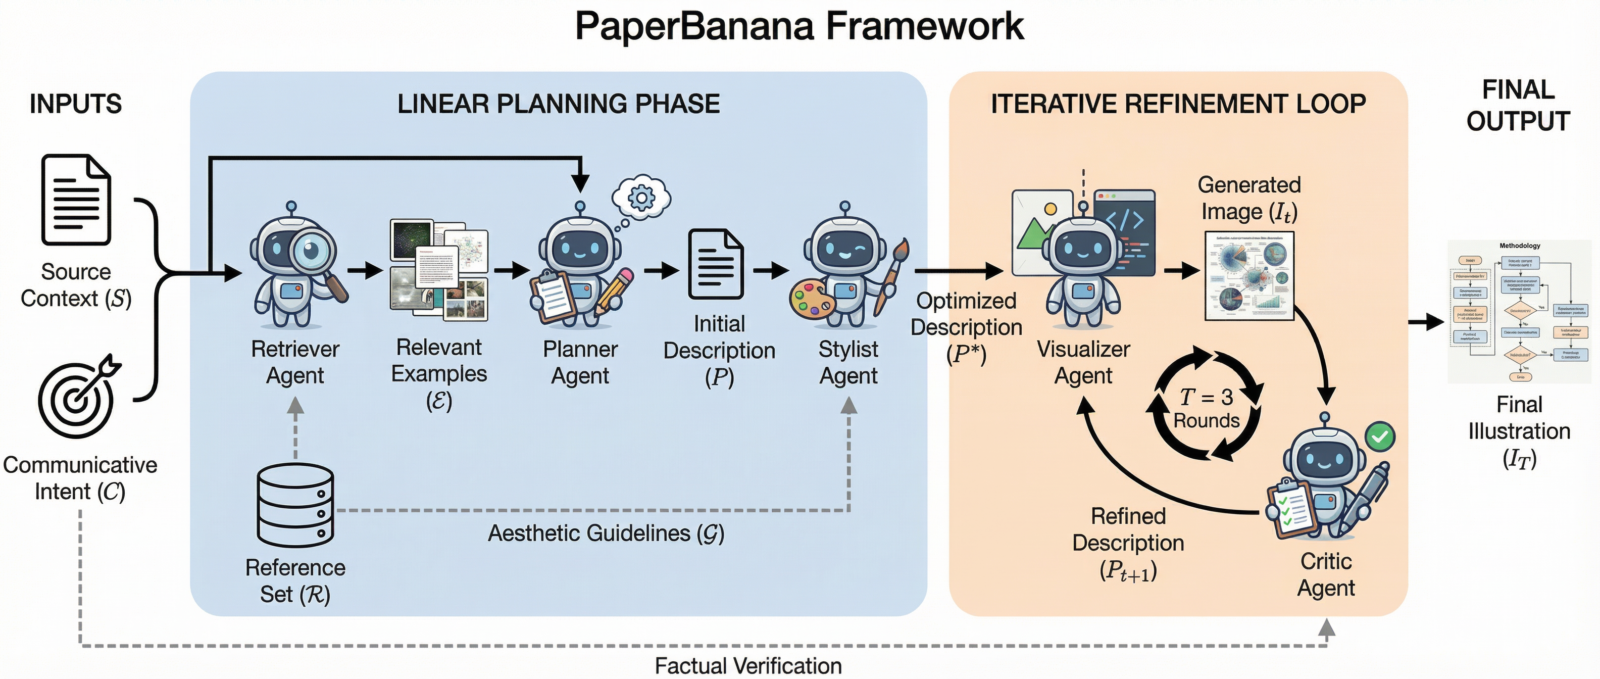
The planner agent then takes over to transform the textual description of the methodology into a detailed visual description. This crucial step translates abstract concepts into concrete graphical elements. But the real innovation comes from the stylist agent, which ensures the diagram adheres to modern academic aesthetic standards. Rather than manually defining these rules, PaperBanana automatically synthesizes them by analyzing hundreds of scientific publications.
The second phase relies on an iterative refinement loop. The visualizer agent, powered by state-of-the-art image generation models like Nano Banana Pro, creates the diagram from the optimized description. Then the critic agent meticulously examines the result, identifying factual errors, visual inconsistencies, or areas for improvement. This process repeats three times to ensure high-quality output.
PaperBananaBench: A Benchmark for Quality Evaluation
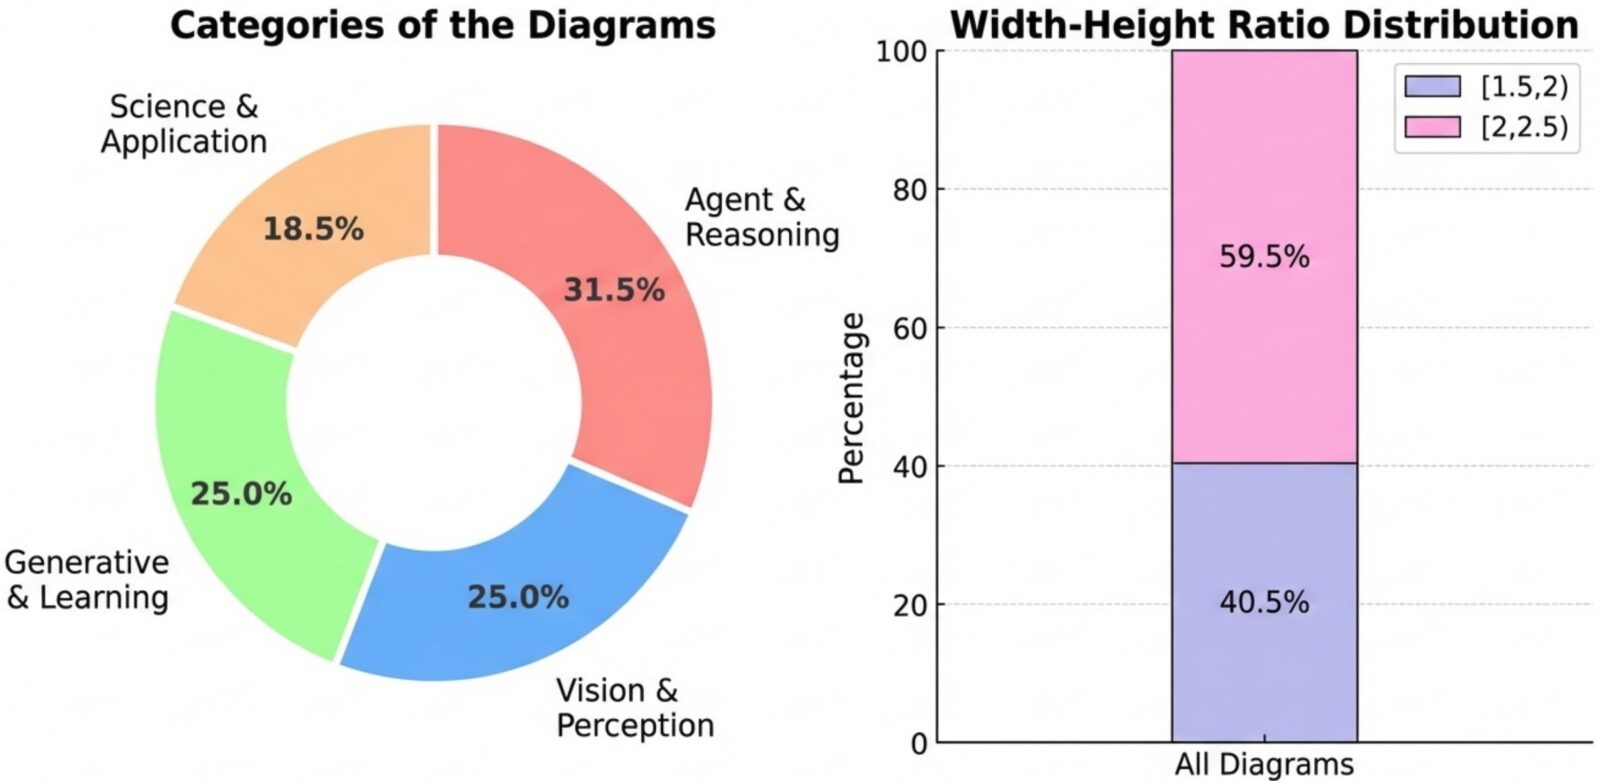
To rigorously measure their system’s performance, the researchers created PaperBananaBench, a benchmark composed of 292 test cases extracted from NeurIPS 2025 publications. These examples cover various artificial intelligence research themes, ranging from multi-agent systems to computer vision, including generative models.
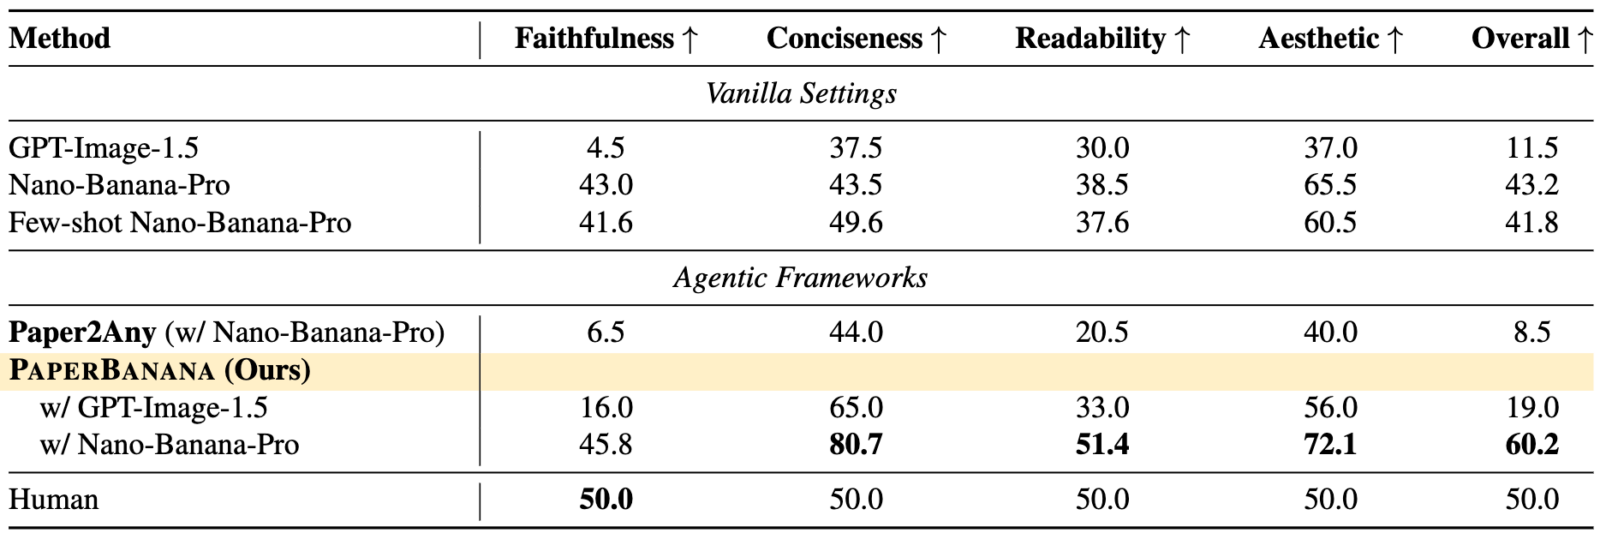
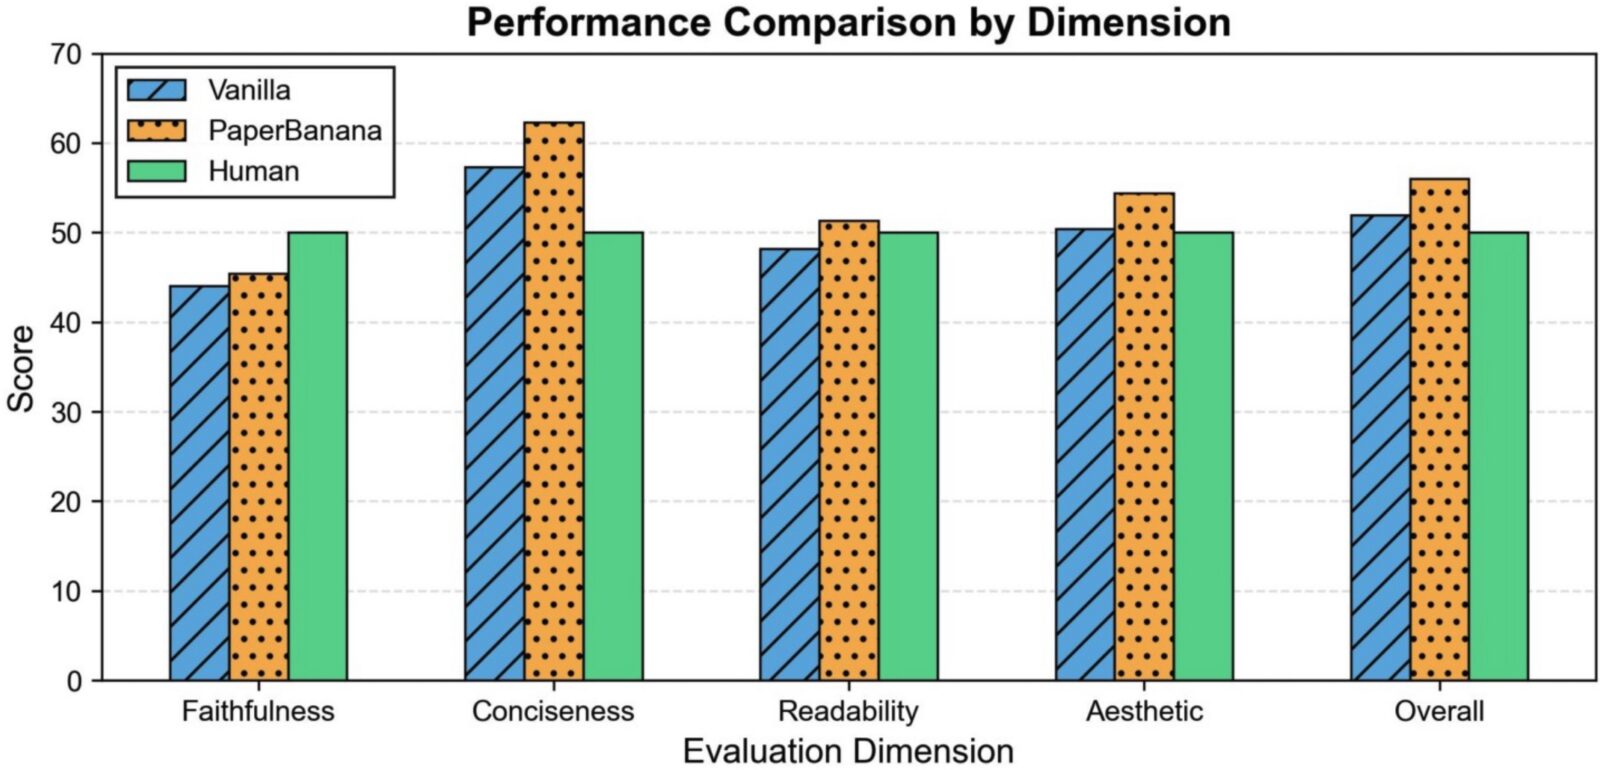
The evaluation relies on four dimensions: faithfulness to original content, conciseness, readability, and aesthetics. The results are impressive. PaperBanana consistently outperforms baseline methods. These figures demonstrate that the system doesn’t simply copy examples but truly learns to generate adapted and professional diagrams.
Promising Applications Beyond Diagrams
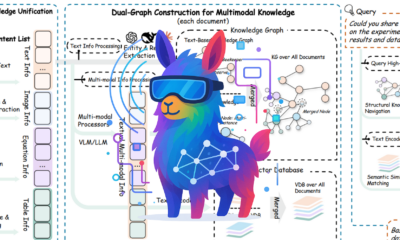
One of PaperBanana’s strengths lies in its versatility. Beyond methodology diagrams, the framework naturally extends to statistical plot generation. By simply adapting the visualizer and critic agents to generate executable Python code rather than direct images, PaperBanana can produce data visualizations that are both accurate and aesthetically compliant with academic standards.
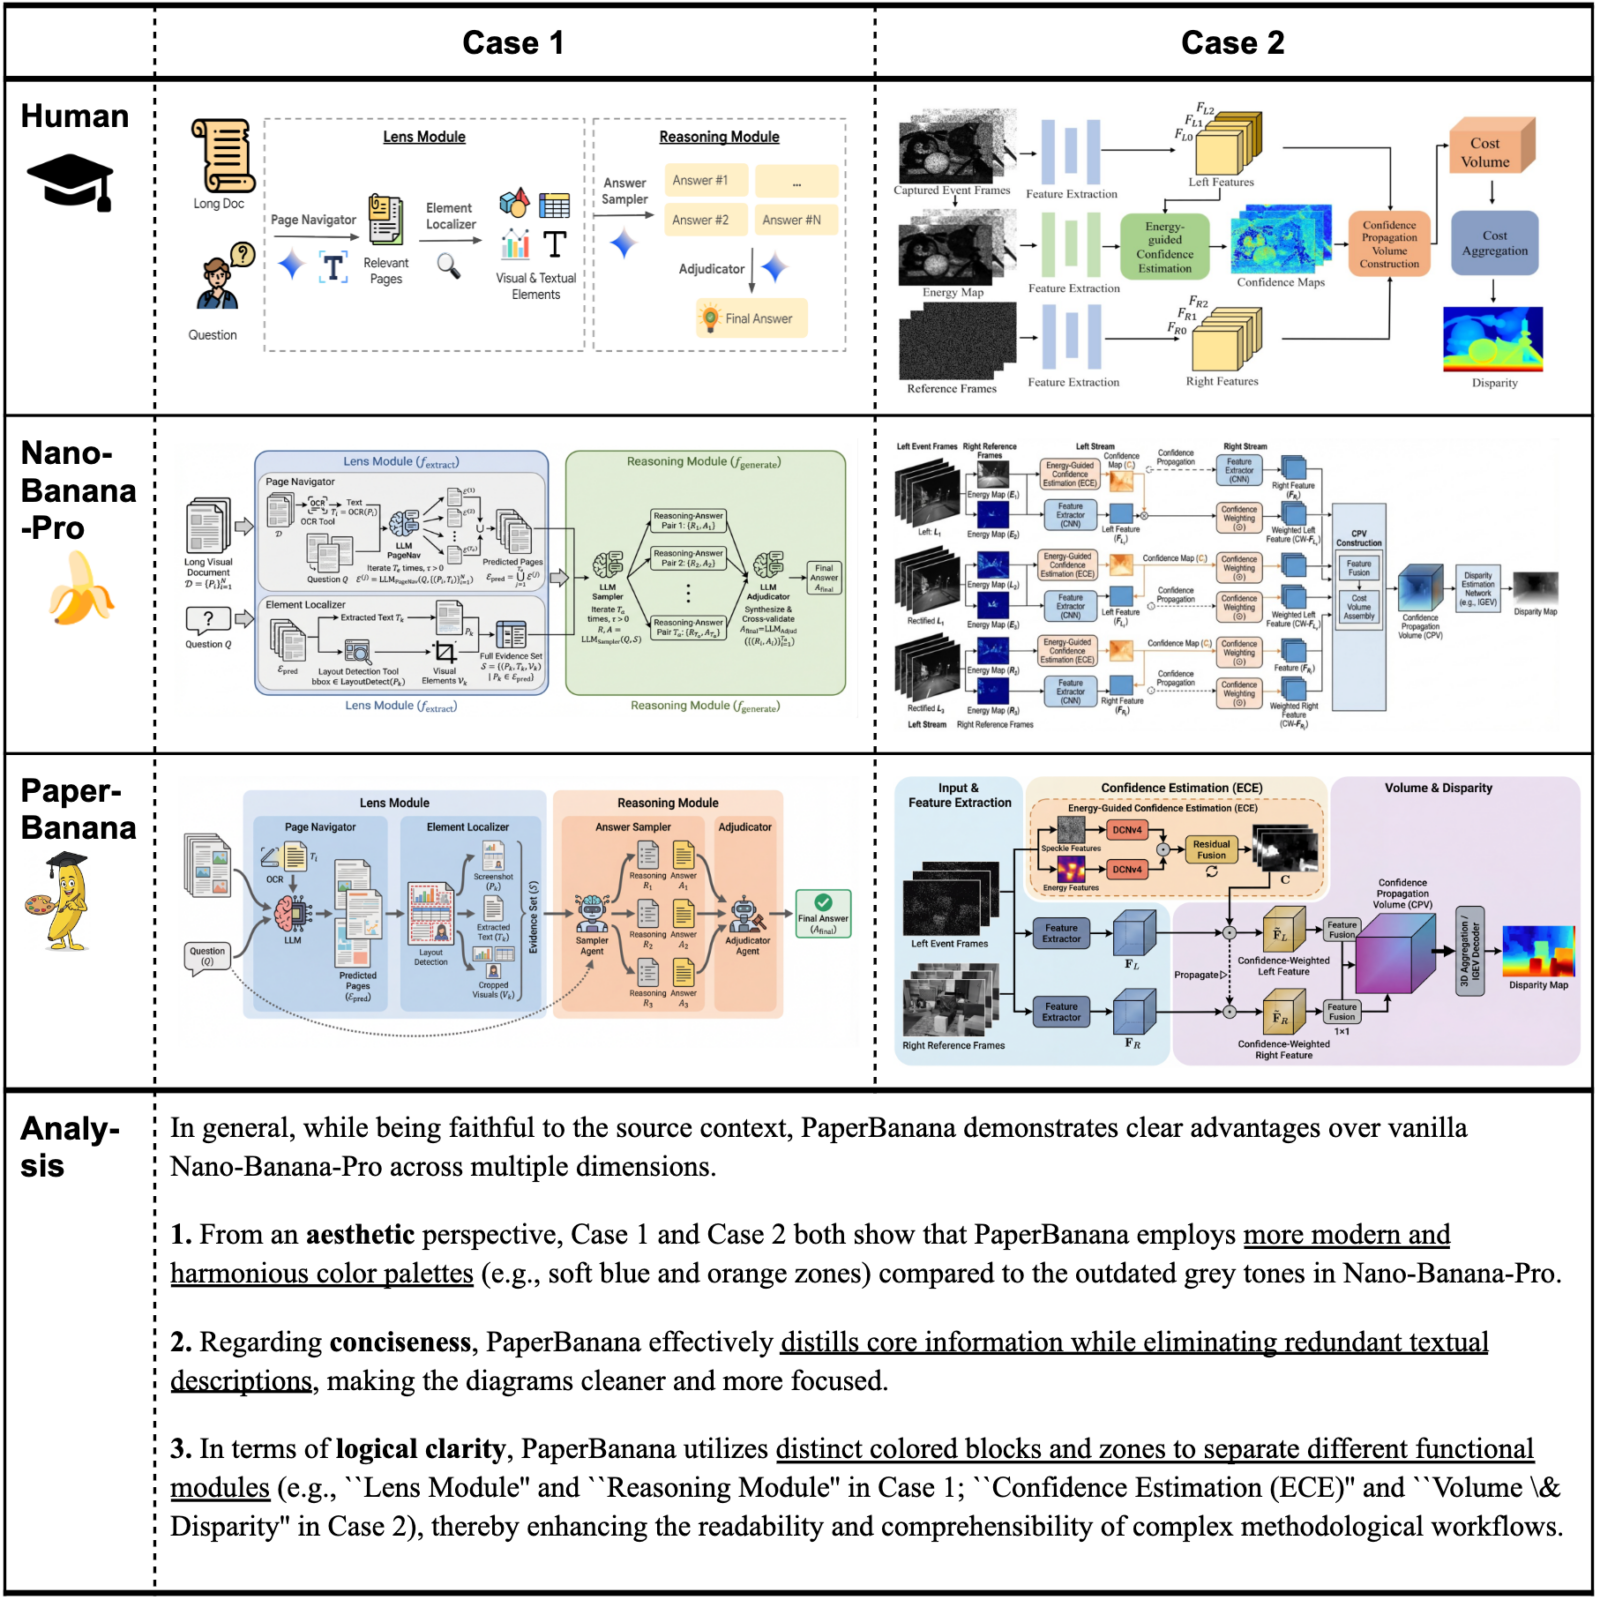
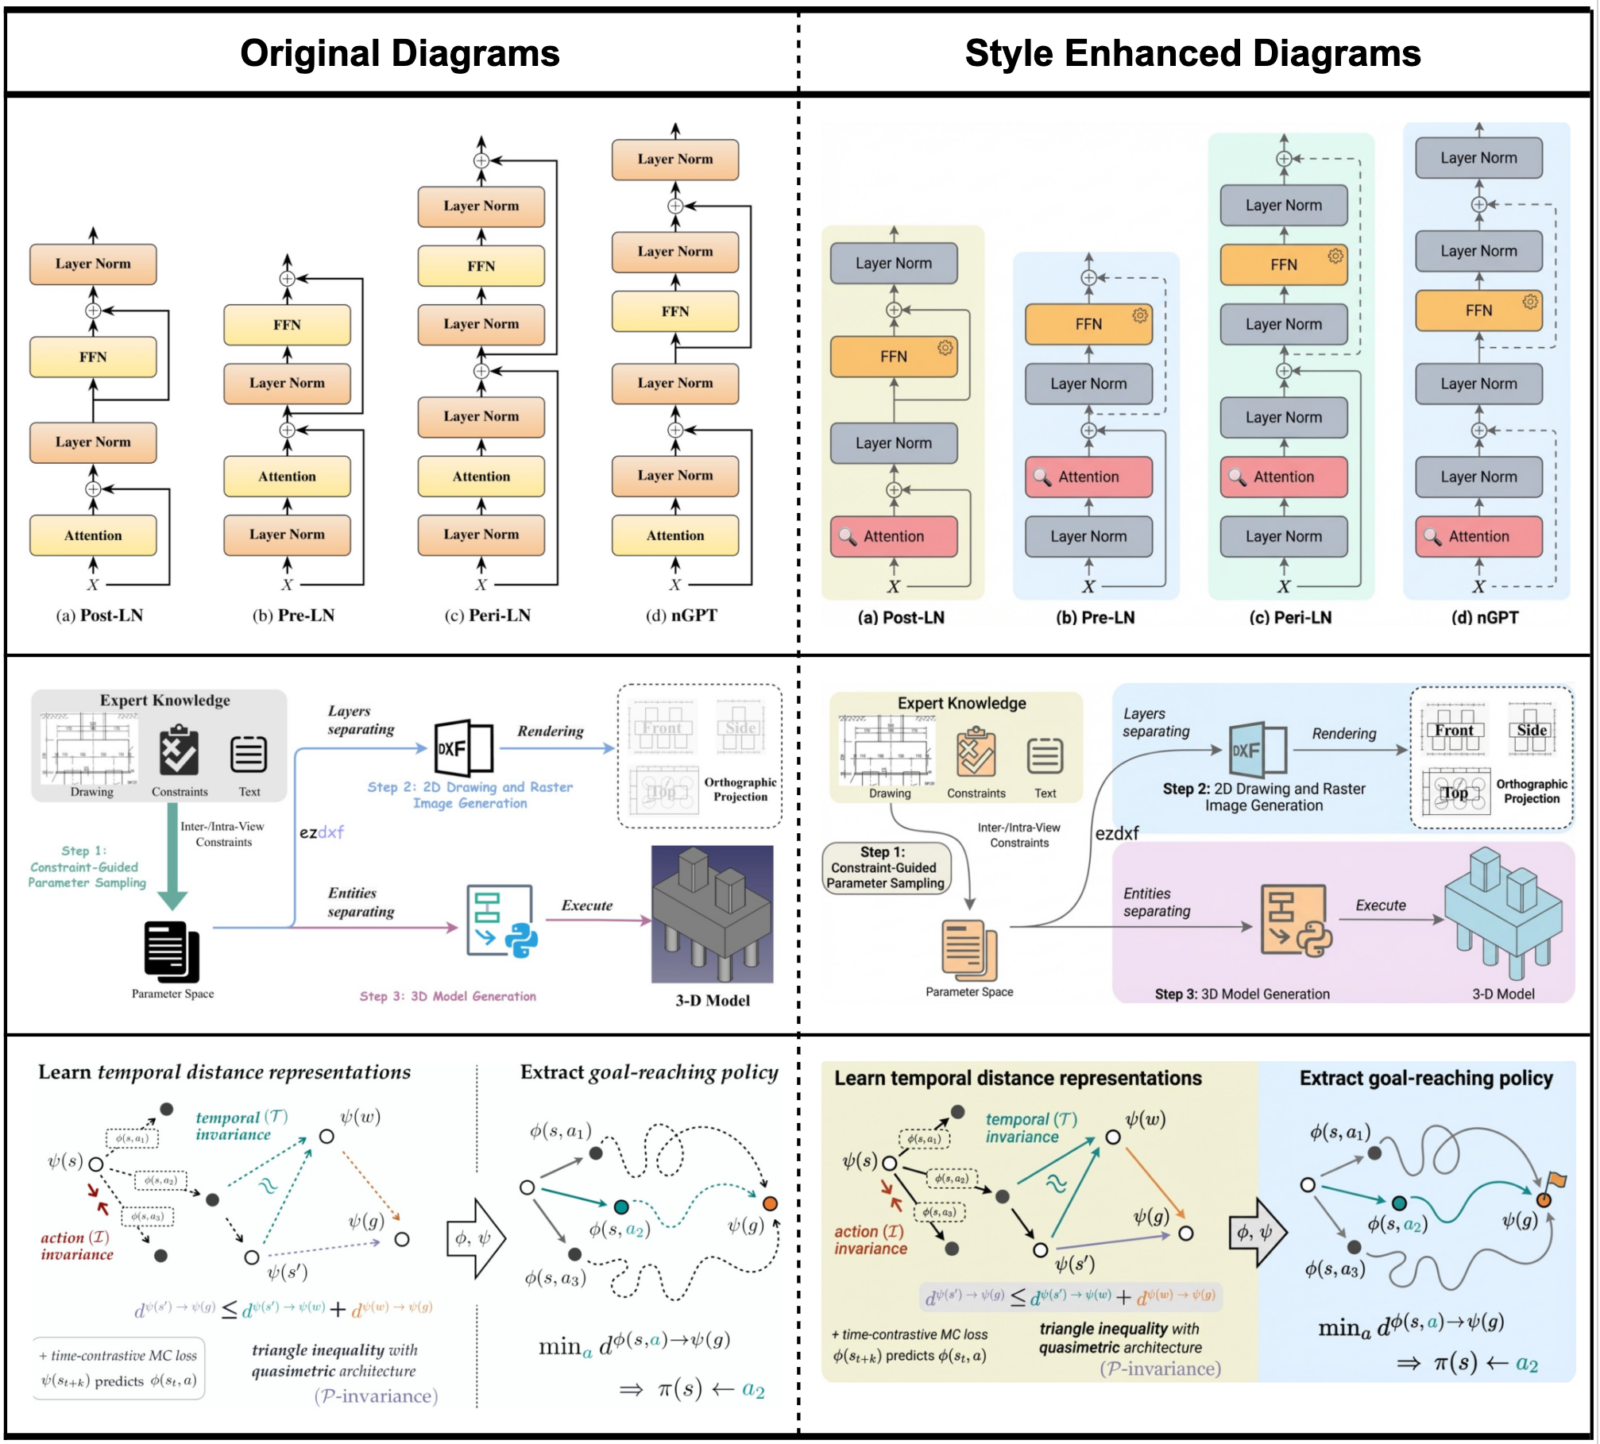
These improvements optimize the readability and comprehension of complex methodological flows in scientific research, clearly surpassing the human and Nano-Banana-Pro versions. Source [2]
The researchers also explored an intriguing application: improving the aesthetics of diagrams already created by humans. By applying automatically synthesized style guidelines, the system can modernize existing illustrations, enhancing their color palette, typography, and overall composition.
Toward Complete Automation of Scientific Communication
PaperBanana represents a significant advance toward automating visual scientific communication. Although the system still has certain limitations, particularly in fine-grained management of connections between modules or generating editable vector files, it paves the way for a new era where researchers can focus more on their discoveries than on their formatting.
At a time when language models are revolutionizing scientific writing, PaperBanana fills a critical gap by automating the creation of professional illustrations. This innovation could democratize access to high-quality visual communication tools, particularly for researchers with limited graphic design resources.
Zhu, D., Meng, R., Song, Y., Wei, X., Li, S., Pfister, T., & Yoon, J. (2026). PaperBanana: Automating academic illustration for AI scientists. arXiv preprint arXiv:2601.23265. https://doi.org/10.48550/arXiv.2601.23265
PaperBanana: Automating Academic Illustration for AI Scientists